
Tracking Clinical Depression with Headlamp's Patient App
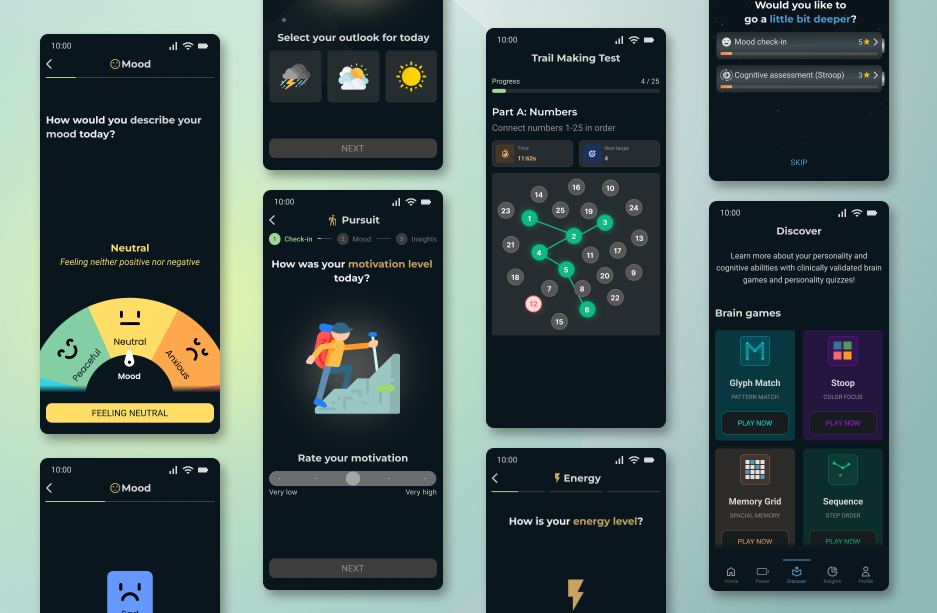
Headlamp's mission is to providing the right patients with the right treatment at the right time. To do so, it needed longitudinal behavioral data on their patients reporting depression symptoms. Our team shipped 3 symptom tracking flows, yielding more clinical data on key MDD factors by 10x on a daily basis.
The problem
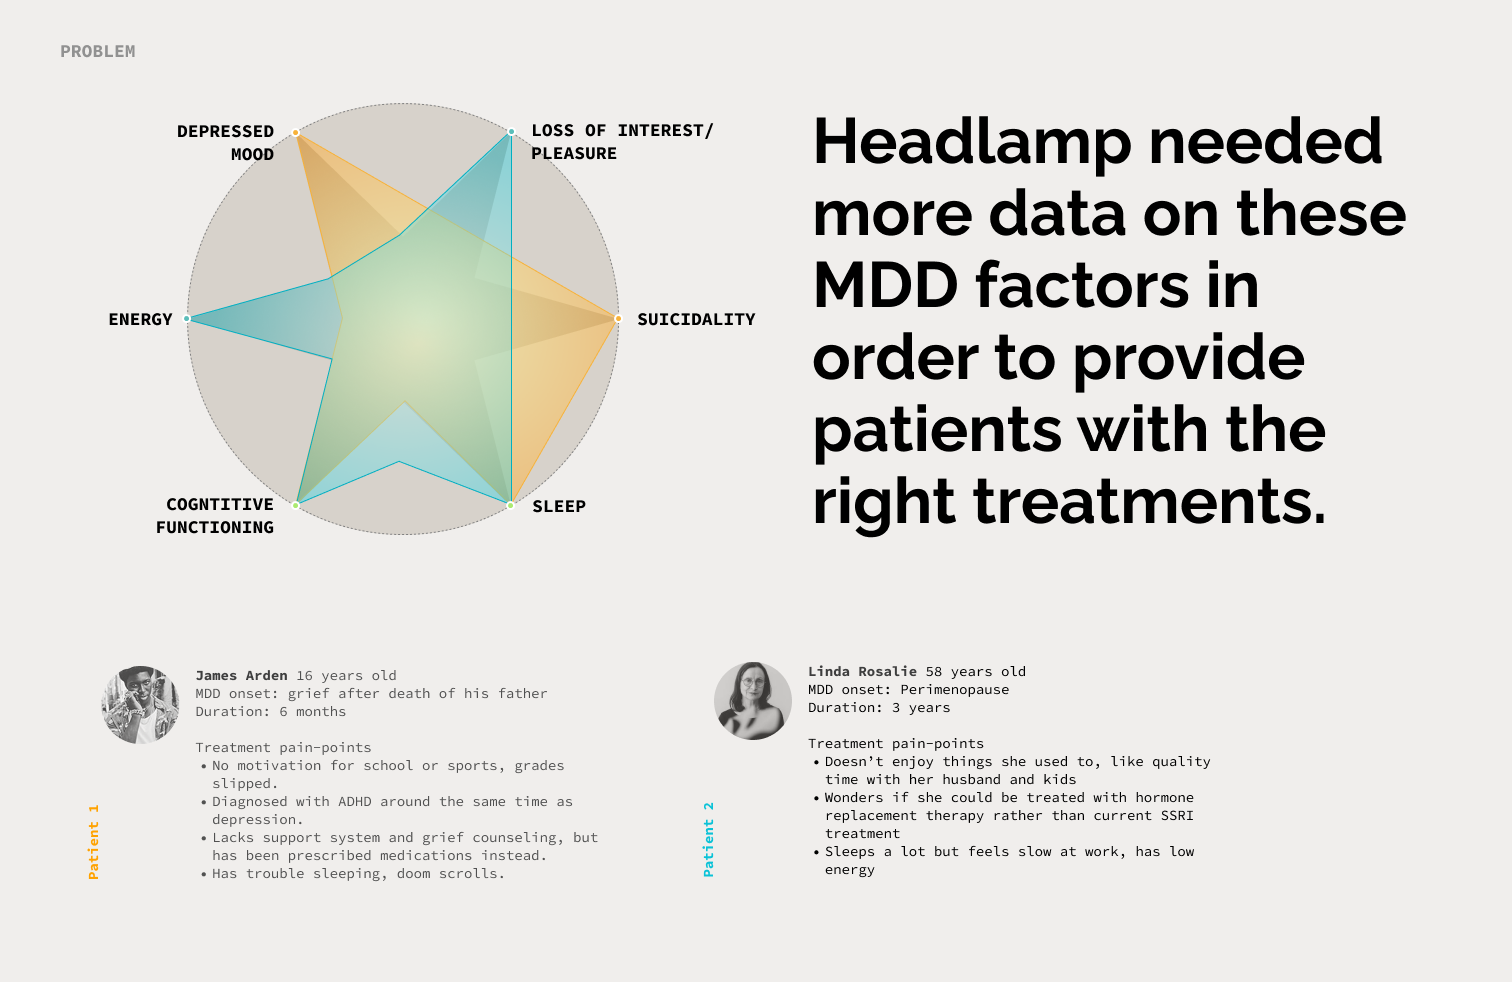
Headlamp’s existing patient app was shallow on Depression (MDD) data. There are six core symptoms that define MDD, and out of those, Headlamp was missing data on four of them: sleep, anhedonia, psychomotor retardation, suicidality. Those that existed (mood & energy) weren't up to clinical standard.
It was also important that Headlamp got data on a daily basis from patients, but most were monthly active users. Headlamp's datset is critical for understanding how to better help patients with clinical depression. It was critical for the data we collected to be of high quality according to expert psychiatrists.
Our intended use cases were to launch these flows into our commercial patient app, which had over 8k active psychiatric patients, and in the future adapt these flows for deployment into clinical trials as a remote patient self-reporting and monitoring solution.
Our solution
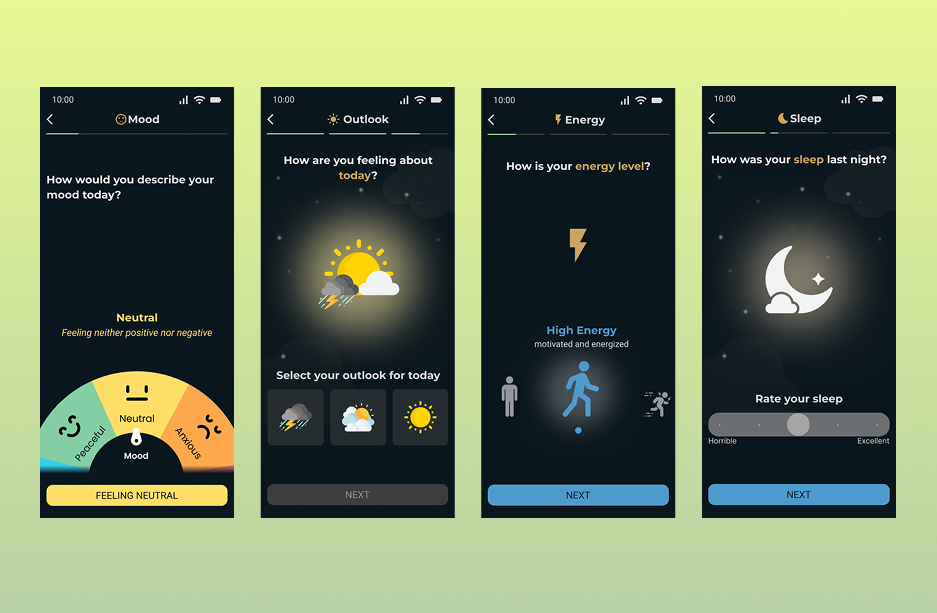
We built 3 daily flows to collect ongoing behavioral and self-reported data from patients, that correlated directly to standard rating scales:
1. Start of the day check-in. Designed to gather a baseline for the patient for four MDD factors including sleep, energy, depressed mood, and anhedonia.
2. End of the day Check-in. Designed to pull a retrospective reflection of the patient’s experience throughout the day, collecting data on four MDD factors including psychomotor retardation, energy, depressed mood, and anhedonia.
3. Mood Log. Designed to help users both record AND identify their moods, with the opportunity for patients to go deeper as the flow continues. Two MDD factors including depressed mood, and anhedonia are collected. Patients are prompted daily as part of the end of the day flow, but its available for patients any time.
The results
Our daily flows were shipped to Headlamp’s Patient App reaching over 8k patients seeing psychiatric providers.
- Captured data on five core MDD factors: mood, sleep, energy, psychomotor retardation, and anhedonia.
- 9/10 patients rated the new flow as being “insightful.”
- 6/6 providers said they would recommend mood logging to new patients.
- R&D uncovered new patient pain-points and core incentives for engagement: symptom, side effect and treatment progress tracking.
- Flows created the opportunity to capture evidence of common depression co-morbidities including: anxiety, mania, bi-polar disorder.
Research
Rating scales (like the PHQ-8, MADRS, etc) are gold-standard for clinical psychiatric monitoring. Most patients are familiar with them because they are used as a diagnostic & monitoring tool for psychiatric symptoms. They are recognized by insurance companies as evidence of measurement-driven care. and can be used for billing and authorization workflows. They are usually quizzes, sometimes self-guided and other times clinician guided.
In the conversations with dozens of providers and patients, I learned that rating scales have major flaws:
1. Patients don’t like them because they are "confusing" and feel "impersonal." So much so that they make patients feel like their provider is out of touch. (This is because they were designed almost a century ago and have scarcely changed since.) We learned oftentimes clinicians even feel reluctant to put them in front of patients because it can taint their perspective of the clinician and hurt clinical rapport.
2. They take too long. (Most frequently between 15-30 min, sometimes even lasting up to an hour.)
3. The resulting dataset is compromised by patient biases (like recency bias and memory loss) due to infrequent deployment. Most rating scales are deployed bi-weekly or monthly.
Approach & data collection strategy
We wanted improve the UX for patients, but obtain clinical validity. So we decided to use the following strategy:
1. Use intentional prompt timing to solve for patient bias. For example:
- Daily questions allowed us to see how many times per week patients experienced symptoms, and this would solve for the patient recency bias.
- Second, because patients typically forget their sleep experience soon after waking, ideally we would have to ask about their sleep soon after waking as well, so that we would have a better chance of get higher fidelity data.
2. Limit patient completion time to < 2 min per flow.
To do so we decided to implement dynamic follow up questions, with a smart prompting logic based on the patients profile, so that patients would not have to answer questions that were not relevant to them. Over time, our prompting logic would become more fine-tuned as we learned more about our patients and their conditions.
3. Take full advantage of the mobile interfaces as a medium, using fun & intuitive UI, to solve for the poor UX of standard rating scales.
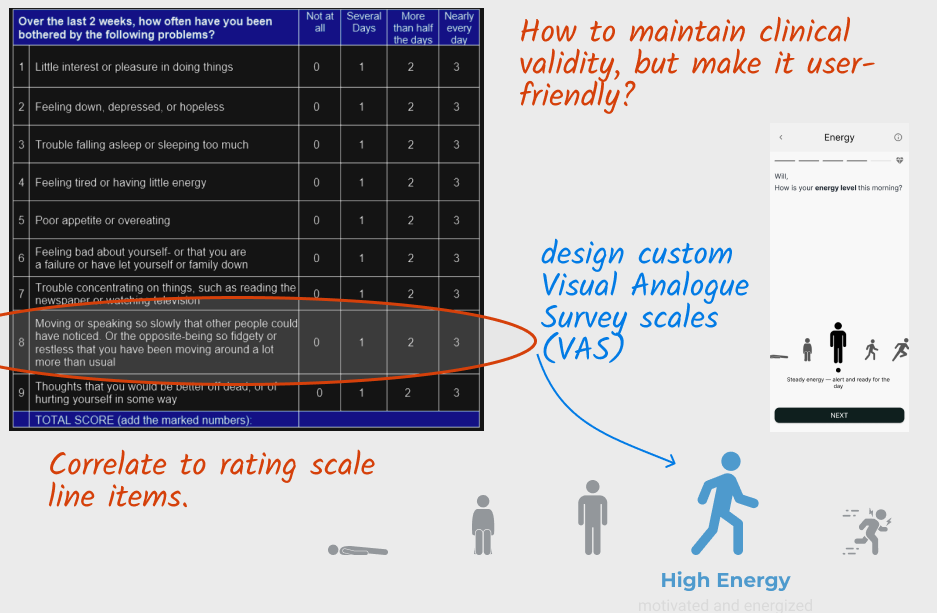
One of our designers, Tanu Sree, had put together some early concepts for energy scales using simple symbols for each severity rating of the scale. We later found that these scales have a formal name in research methods; they are called Visual Analogue Survey Scales (VAS), and are a commonly used research tool. Our team designed five VAS for mood, sleep, energy, outlook, and motivation. Each correlated to standard Leikart scales and psychiatric rating scale line items.
Correlating to the gold-standard rating scale line items allowed us to get a daily tally of clinically validated symptoms. We also felt this approach would lead to a higher quality dataset than the standard question of "Over the past 2 weeks, how often have you felt....xyz symptom," solving for patient memory loss.
Mood Log deep dive
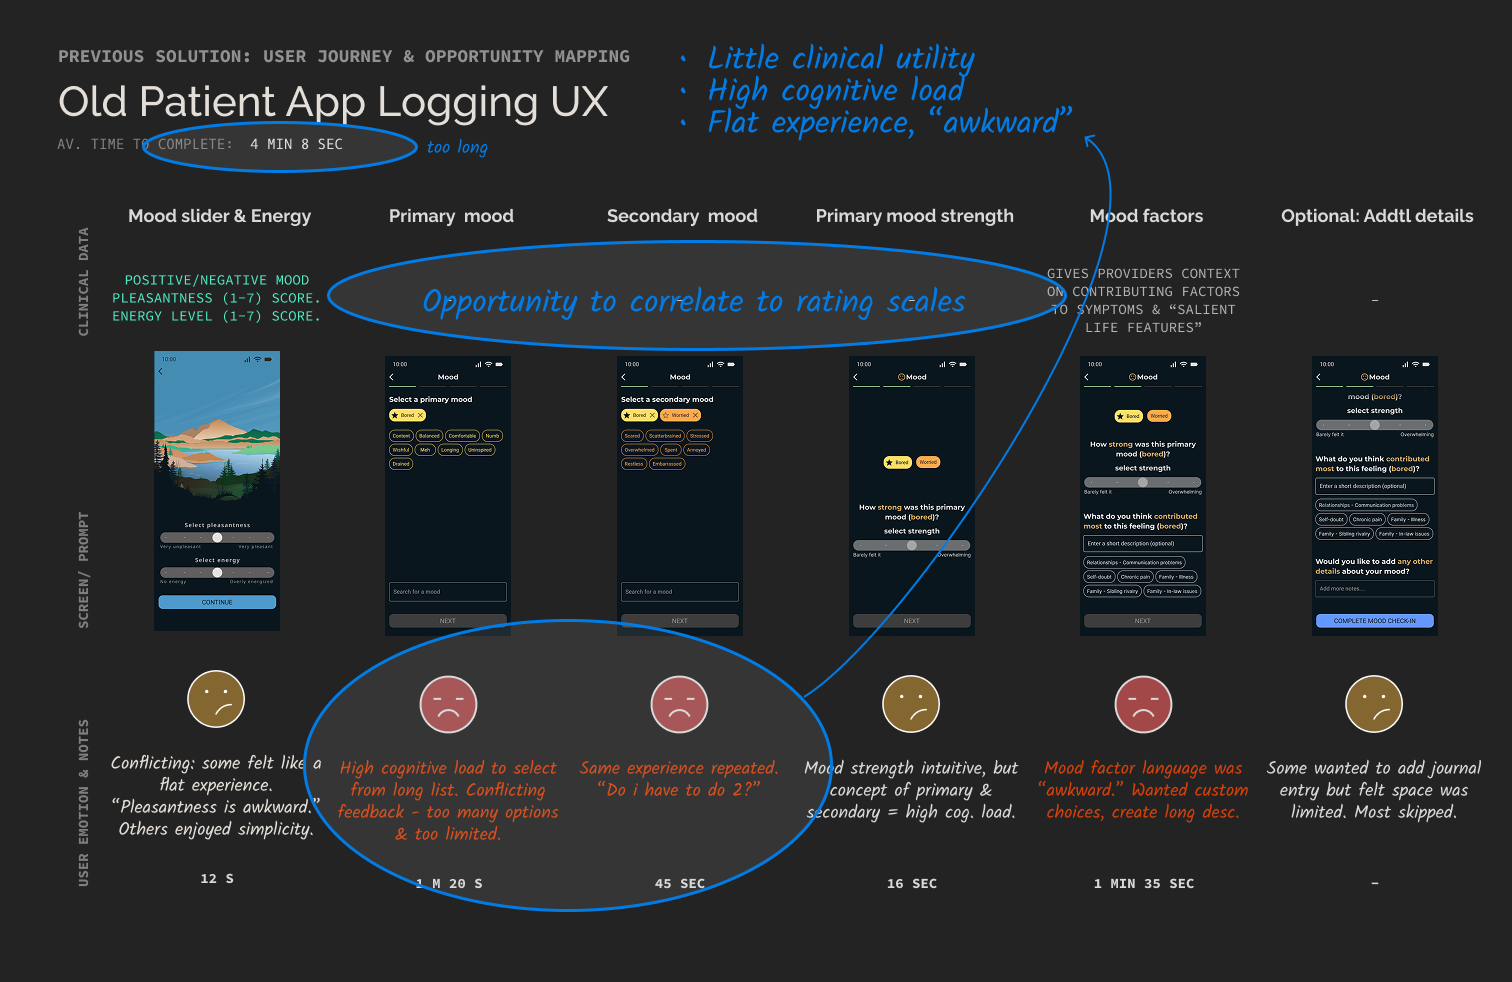
Mood log posed a unique challenge for the team, partially because we had already gone through multiple mood log iterations in the past. The team's previous approach to mood log was ultra-minimalist including simple mood & energy sliders on the same screen. Some patients found it refreshing, others found the UI limmiting.
Research: We pooled user feedback from our existing flows, spoke to our providers who had deployed the app to their patients, and those reluctant to do so. The core insight that guided the next version of our mood log design was that in order to make the mood log more accessible to patients, we needed a UI that help patients identify their emotions.
- "Some patients have trouble identifying their moods."
"Patients who are depressed often feel numb. They feel detached from their emotions.
- Dr. Jason
These provider anecdotes were consistent with our ux recording and app usage patterns; we saw x% of patients drop off during the mood log flow. Selecting keywords was the point of friction, with some patients taking over 3 minutes just trying to find the right keywords.
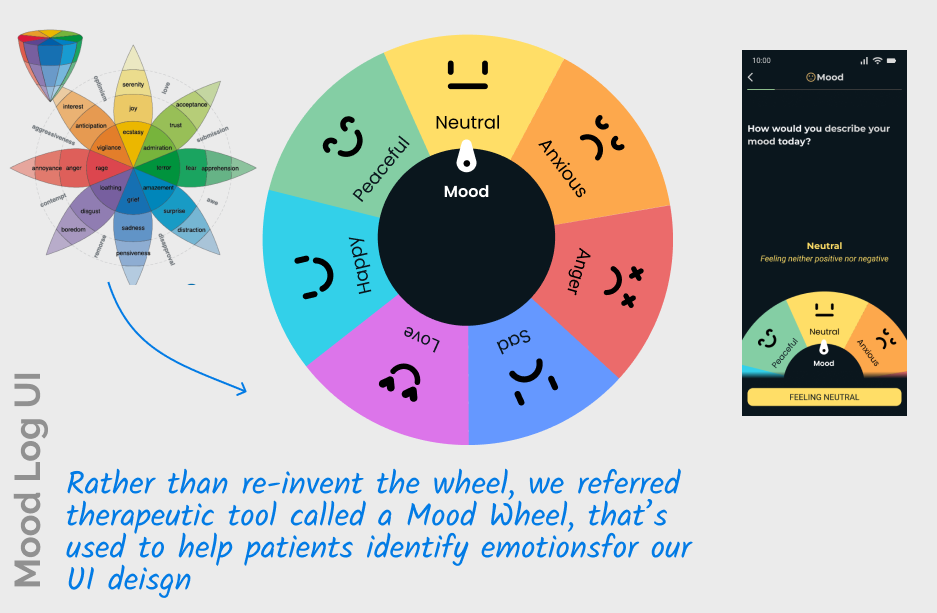
Our Mood Log solution begins with a therapeutic tool called a mood wheel, which we adapted to help patients identify their emotions.
The mood wheel was mentioned to us by a provider during an app testing session. Its a therapeutic tool that most providers are familiar with. This familiarity gave us two advantages. First, using familar language as mental health providers gave us a higher likely-hood of adoption with providers. Second, it aimed to be sort of a mini-activation flow for daily reflection with our patients, aiming to make reflection approachable where it can be very taxing otherwise.
The mood log was designed to help users identify their moods, with the opportunity to dive deeper into introspection as the flow continues.
"It's not often in this profession that I see something that makes me smile, so when I do I make sure to call it out. This is the most user-friendly app I've seen in a clinical setting."
-Dr. Genovese
.svg)